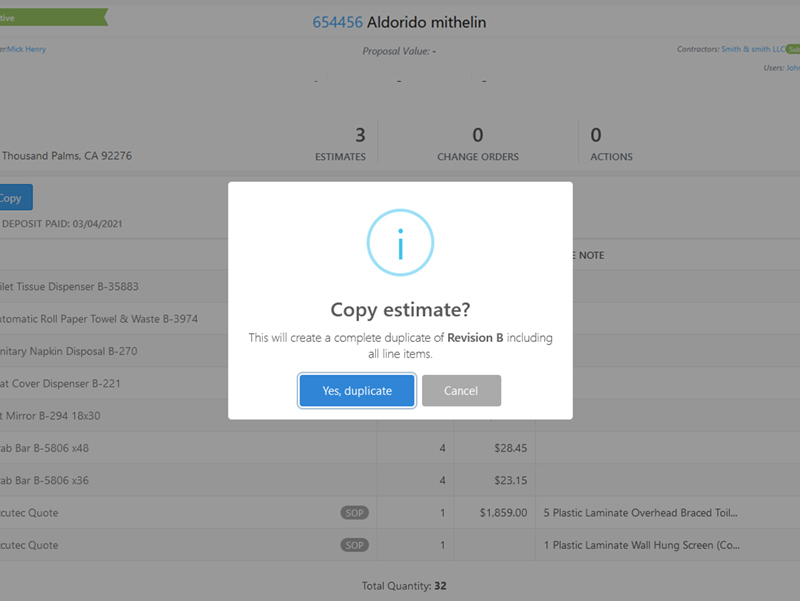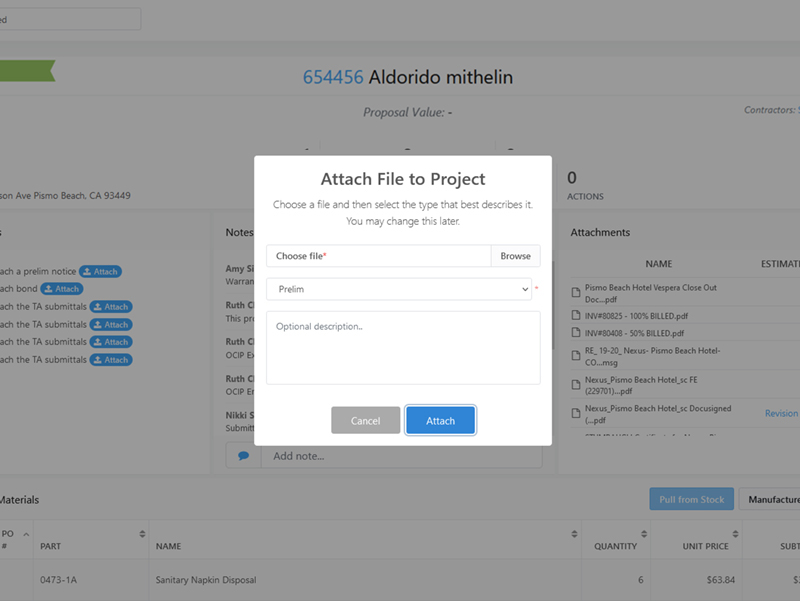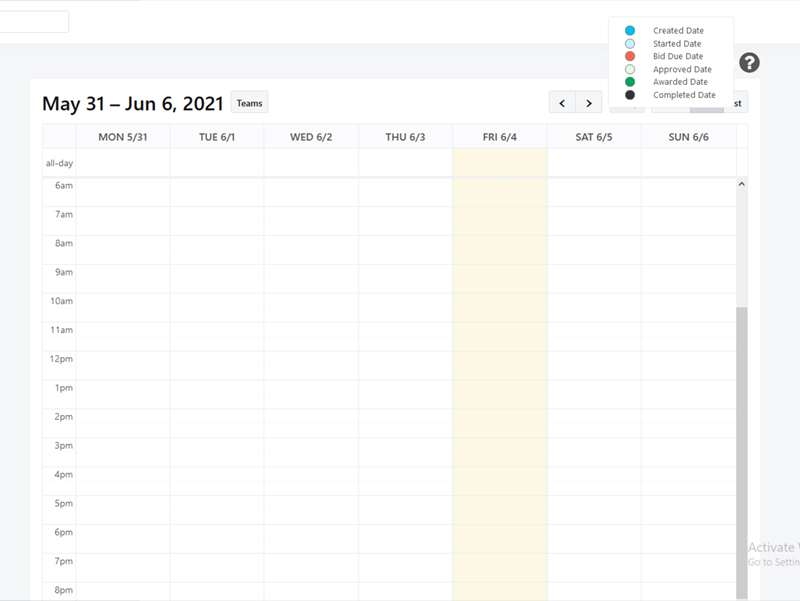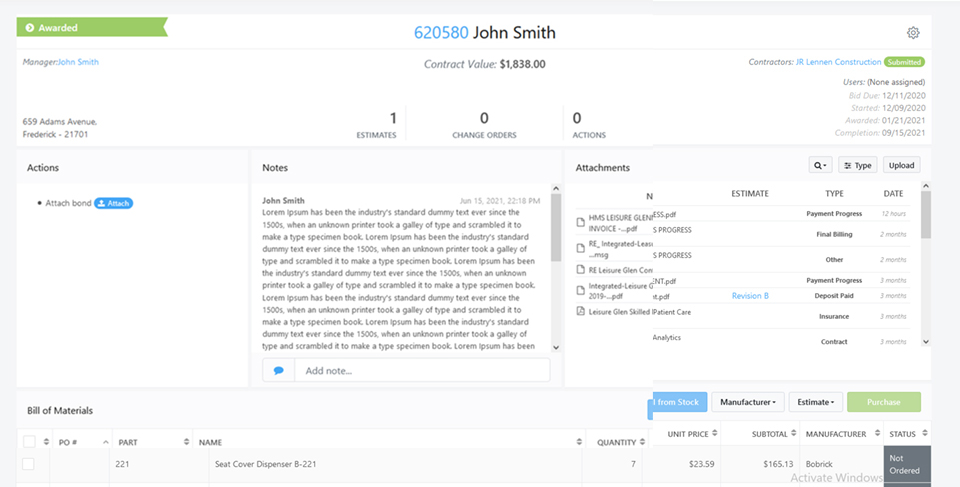
Customizable dashboards
Quellosoft’s dashboard library puts your key metrics front and center, allowing you to view your data in the way you prefer. Including, pie charts, bar charts or pivot tables.
Schedule and share dashboards
Don’t be siloed with your custom dashboard. Share and schedule your dashboard to key stakeholders in whatever format suits your business, for example pdf or .csv. Automated scheduling eases the weekly report distribution. Get what you need, when you need it.


Geo-spatial heat maps
Create geo-spatial heat maps of your fieldworkers, orders or projects. See where the majority of your jobs sit and where you top client projects are located.
Important Features
-
Timesheet reports
Capture digital timesheets from the job site. Analyze activities, pay and charge rates per project.
-
Safety reports
Collect safety forms, and conduct corrective actions immediately. All safety records are stored within the system for audits.
-
Competency matrix
Export your competency matrix for your next audit. All the data is stored in Quellosoft, export it to a complete .csv as well.
-
Project reports
Visualize allocated time versus actual time spent on a project. Measure productivity, cost, and overtime per project.
-
Audit trail
Automatically log everything that’s happening in Quellosoft and in your business.
-
Asset utilization report
Report on hours of operations per asset.
-
Compliance and maintenance report
Report on asset maintenance and compliance.
-
14 different graph types
Visualize data the way you want with heat maps, bar charts, area charts, pie charts, treemaps, and many more reporting options.
Start using Quellosoft today
Improve your entire operations from the office to the field in real time.
Request A Demo